The Storefront Insights Page
The Storefront Insights Page helps you understand how your Storefronts are performing with real time data and exportable reports. Follow the steps below to navigate and use the page effectively.
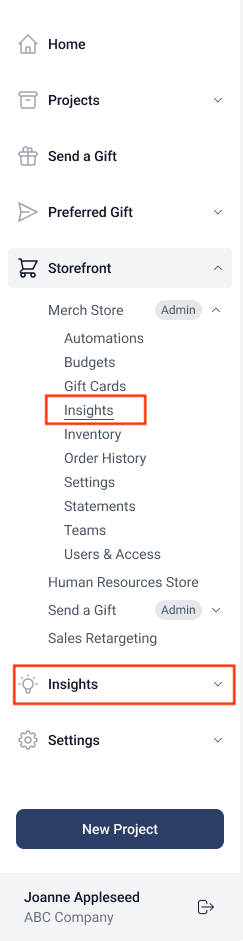
Accessing the Storefront Insights Page
Log into your Client Dashboard. From the left-hand navigation menu, select Insights which takes Store Admins to the Storefront Insights page, which by default loads data from the last 30 days across all Storefronts they can access.
Store Admins can also access Storefront Insights directly under a specific Storefront in the navigation. In this case, the page opens with only that Storefront selected.
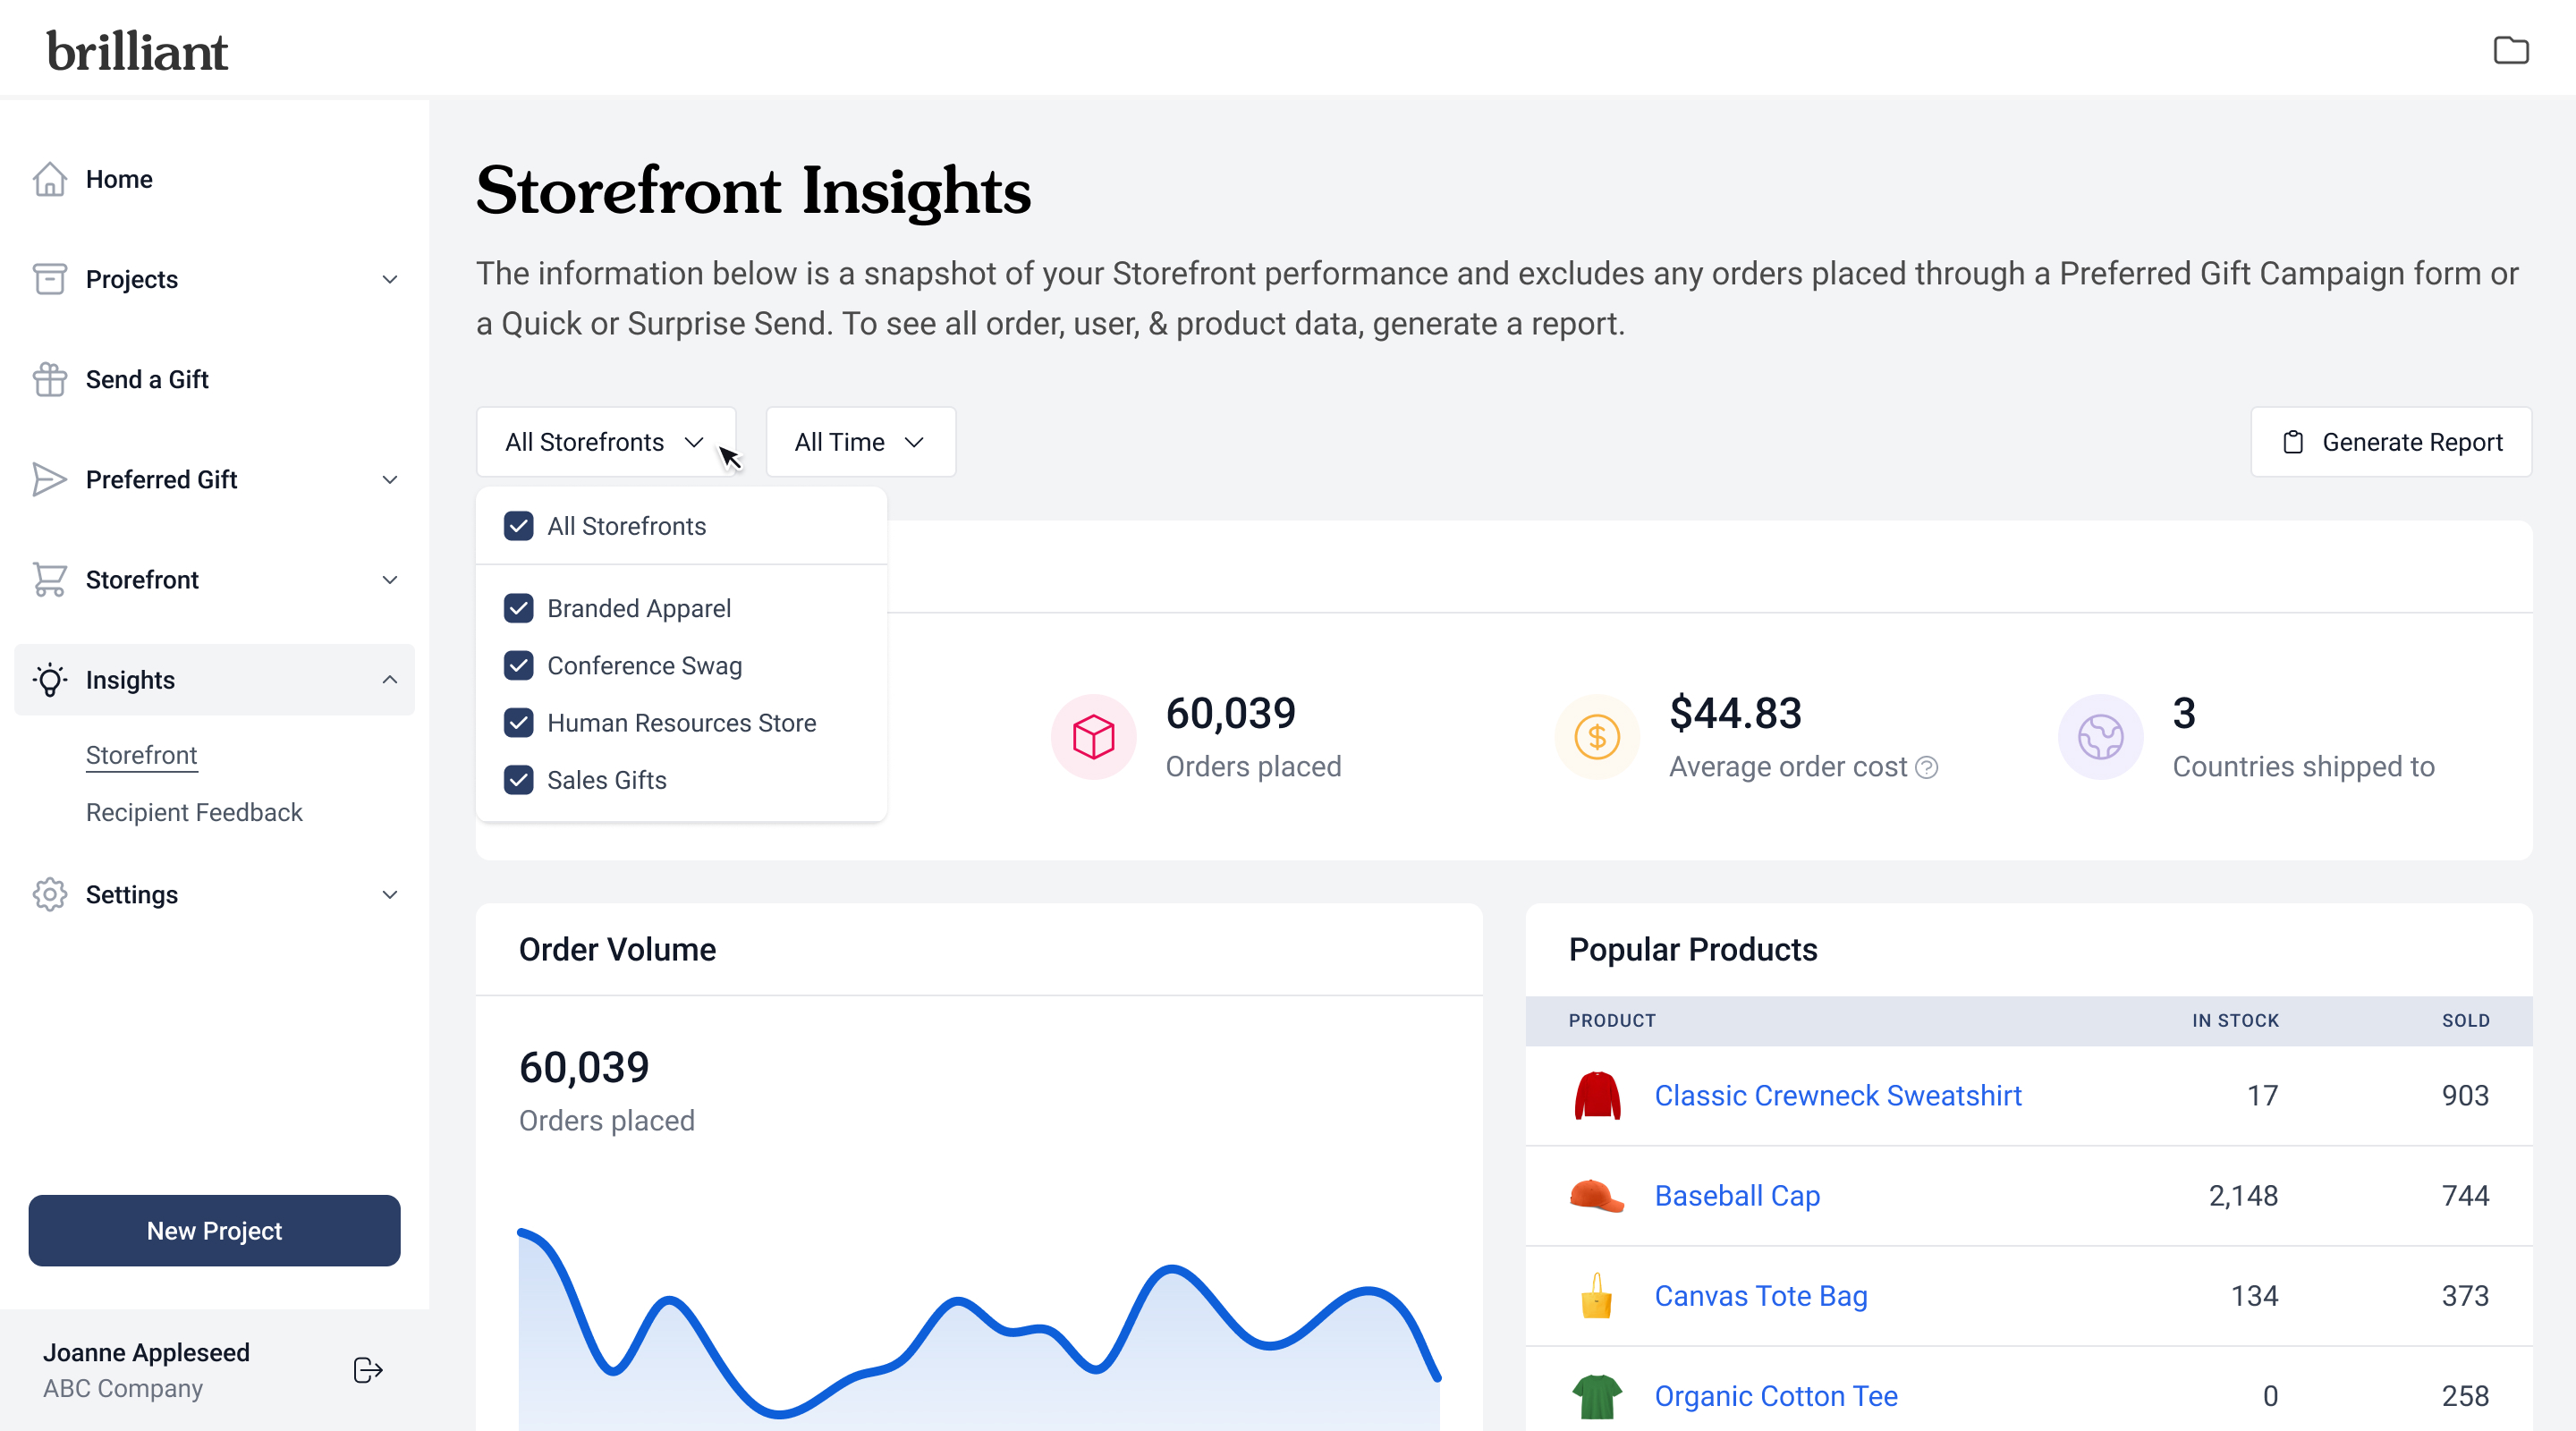
Selecting a Storefront
At the top of the page, locate the Storefront dropdown menu. Choose one or multiple Storefronts you want to view data for. The dashboard will update automatically to show combined metrics for all selected Storefronts.
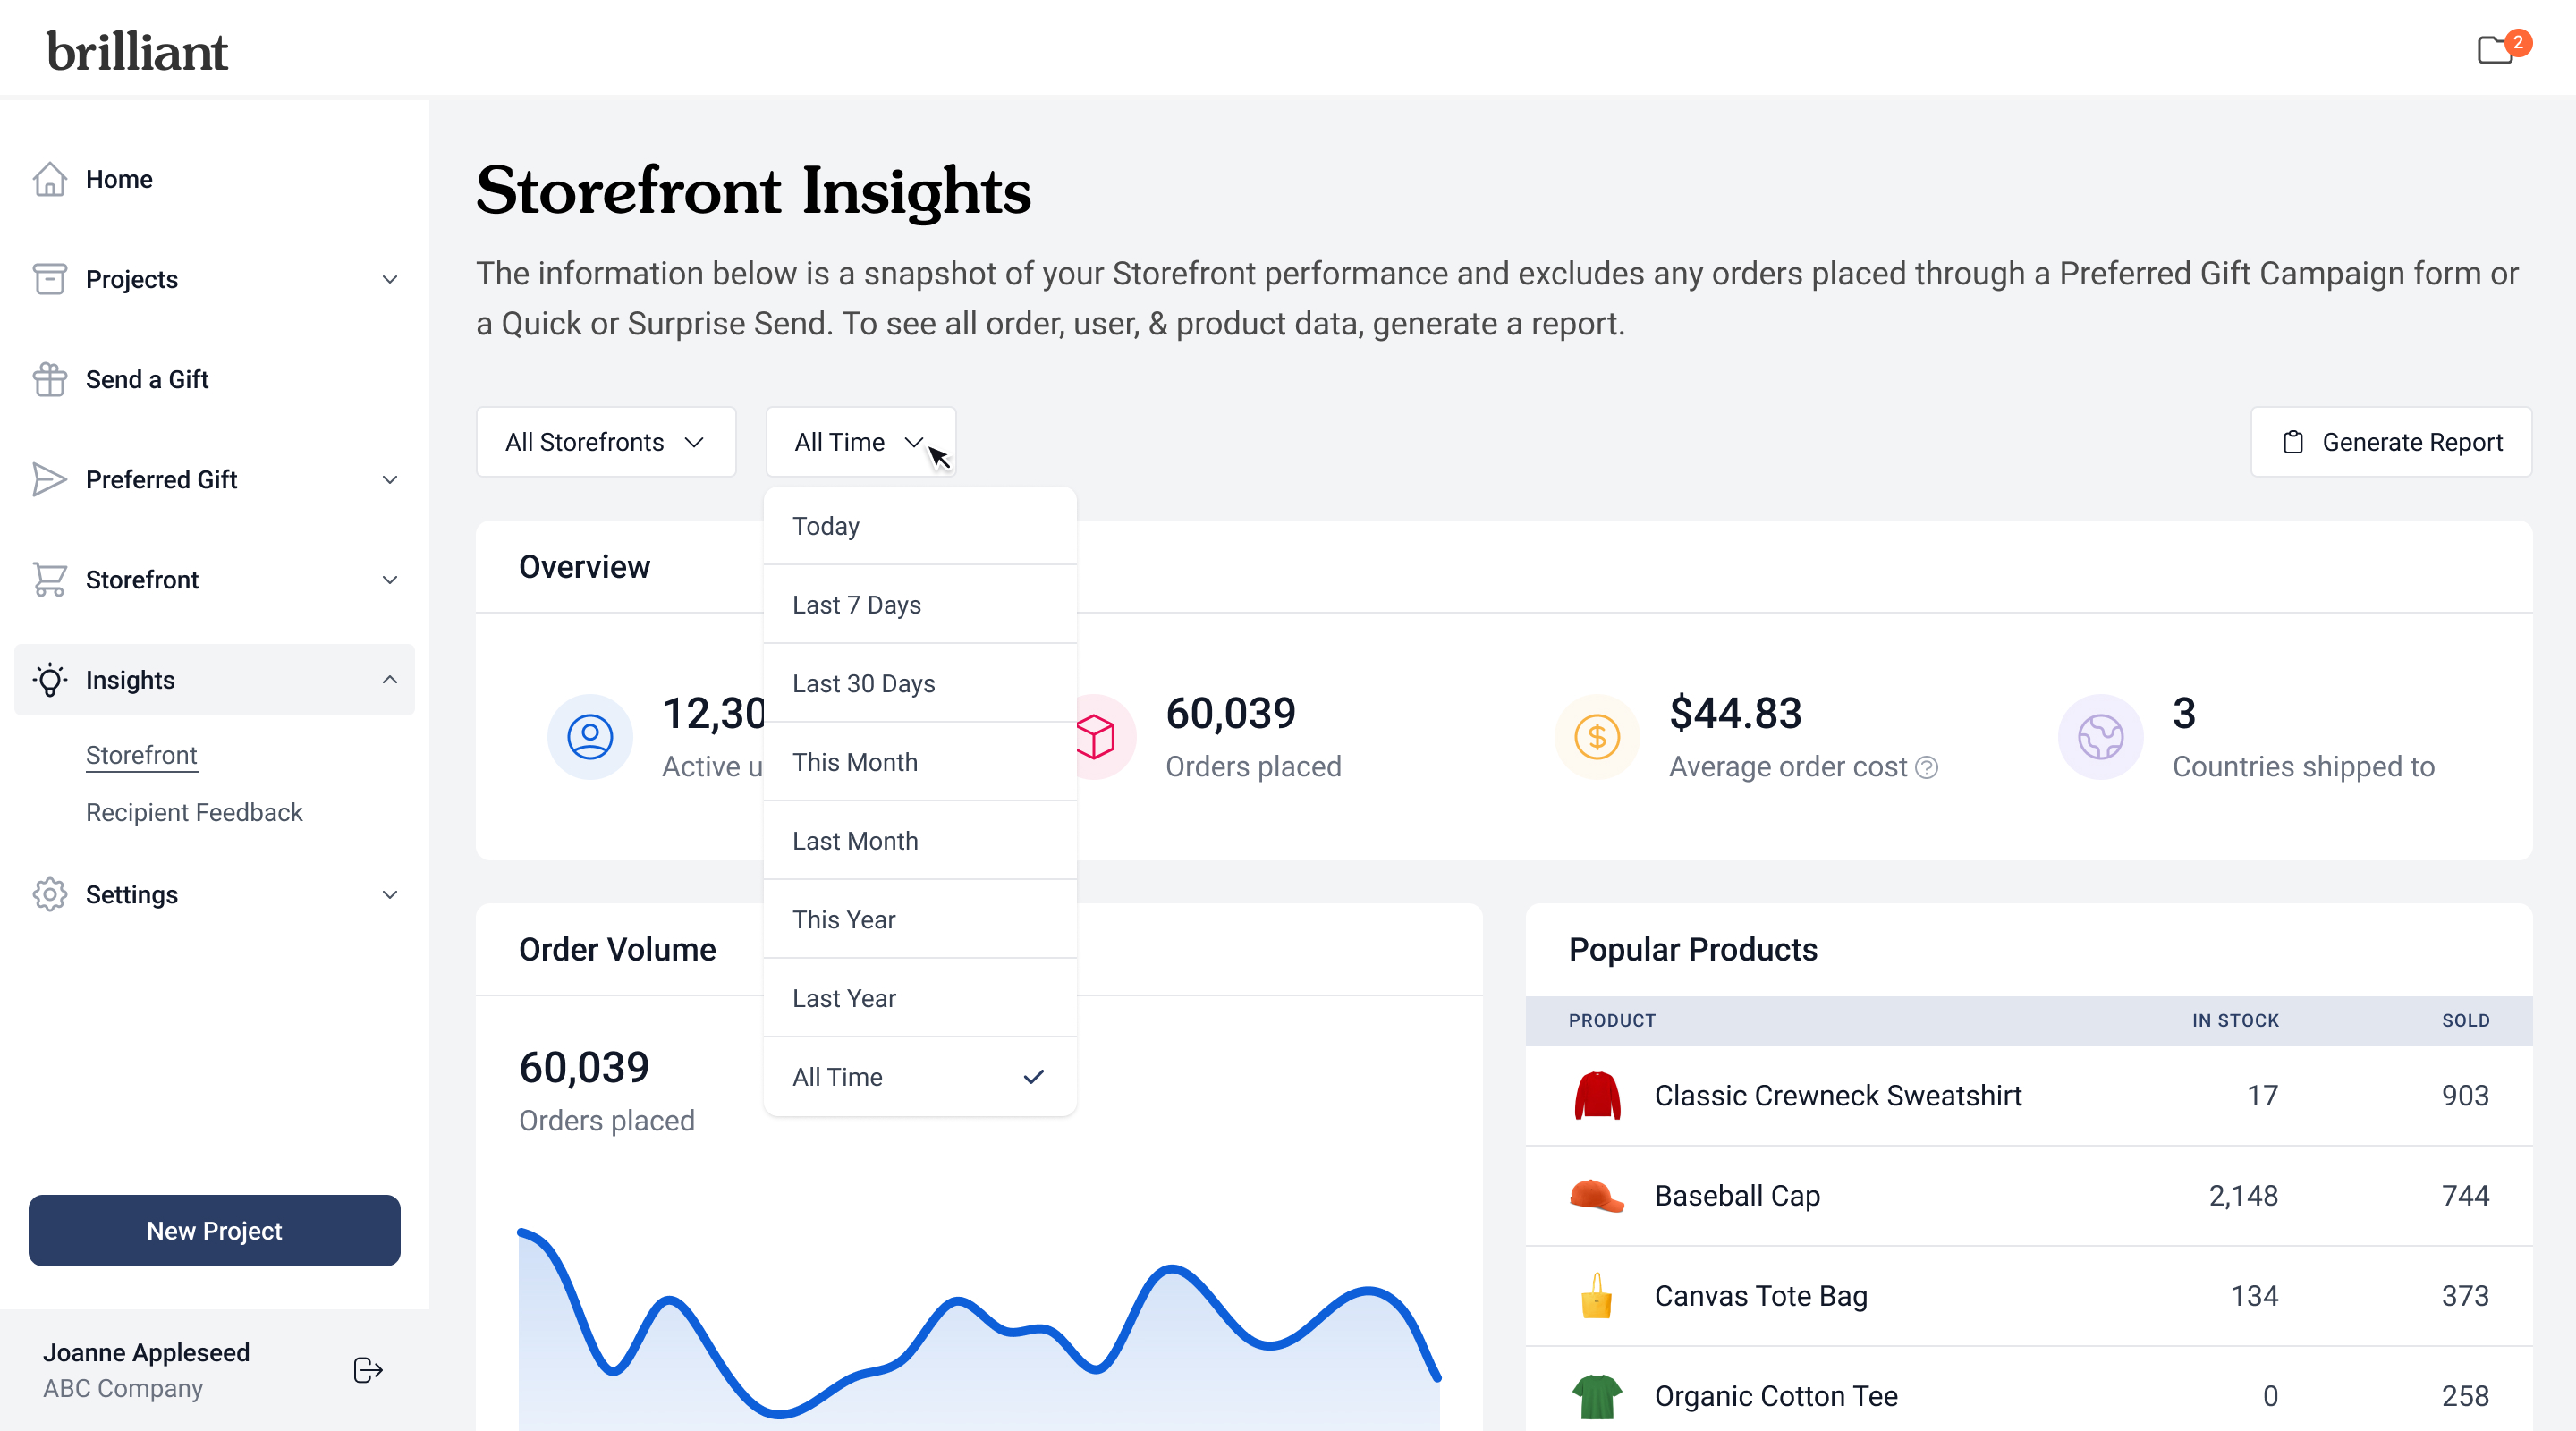
Choosing a Date Range
Use the date range dropdown to filter data for a specific period. You can choose from preset options such as Today, Last 7 Days, Last 30 Days, This Month, Last Month, This Year, Last Year, or All Time. Once applied, all panels will automatically refresh to reflect your selection.
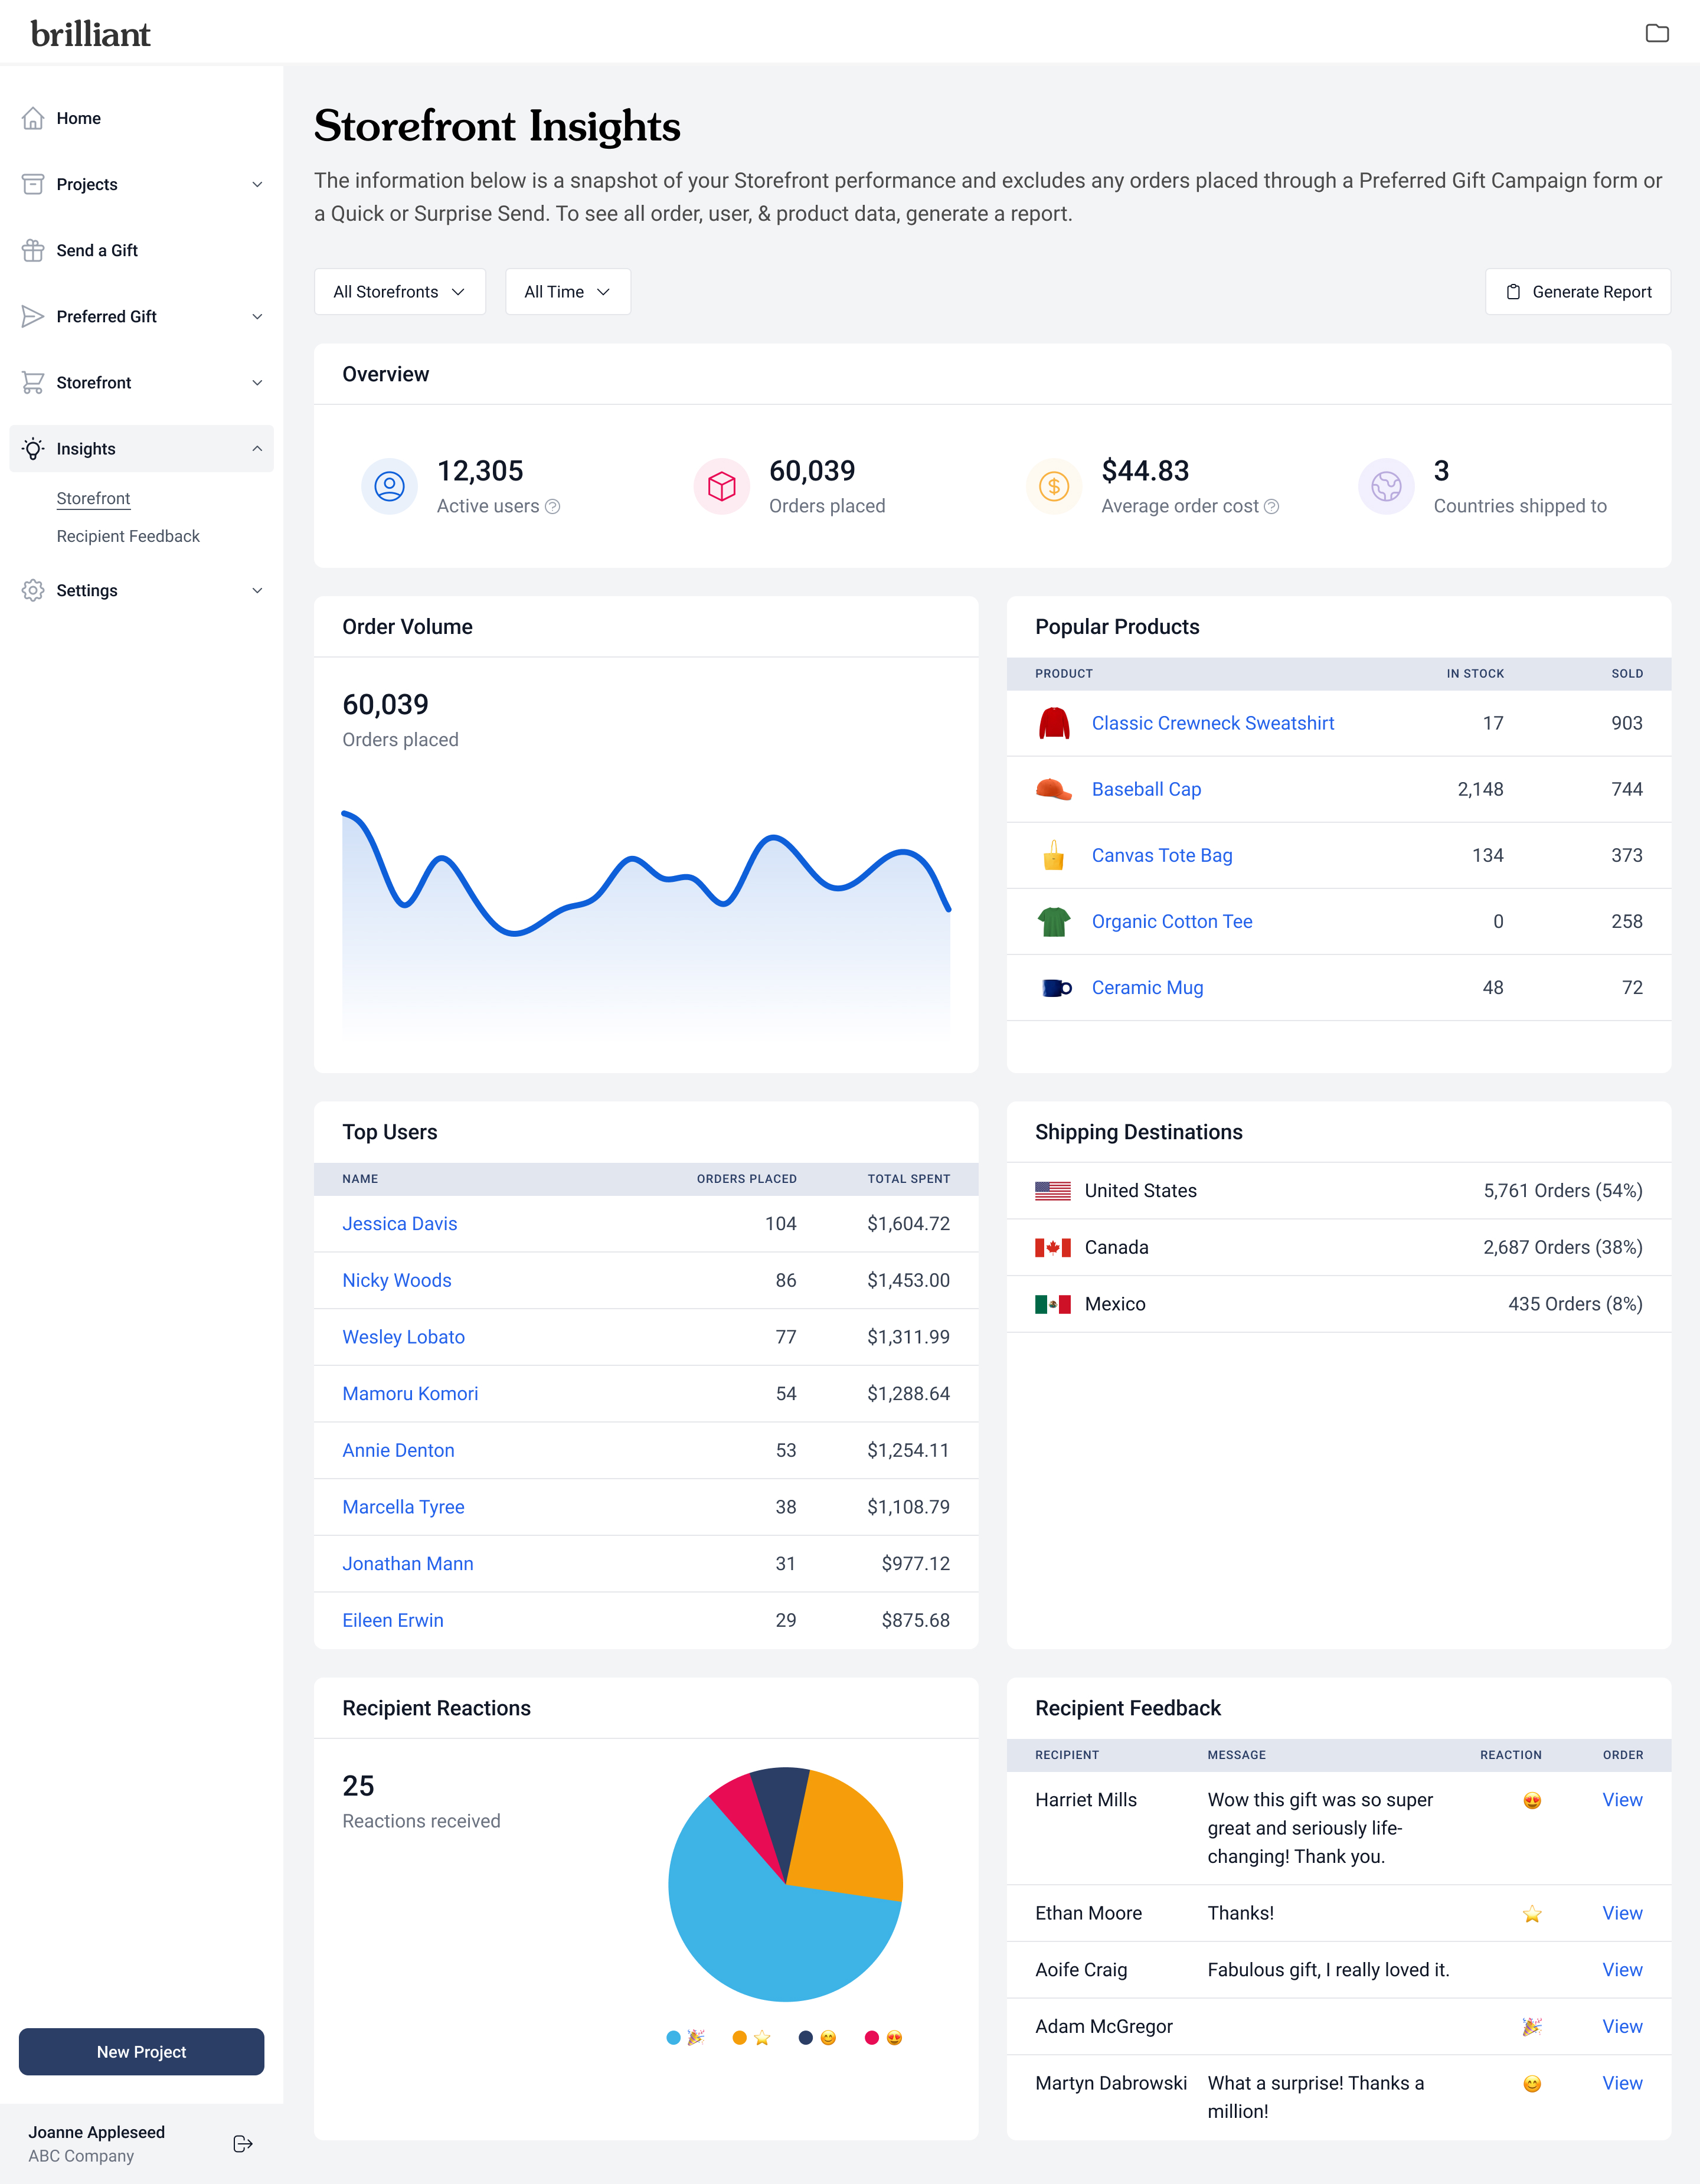
Reviewing Performance Panels
Each panel provides a different lens into your Storefront activity:
Order Volume Panel
The Order Volume panel shows an interactive line graph of Storefront orders over time. Hovering over the graph reveals the exact number of orders by day, month, or year, depending on the selected date range.
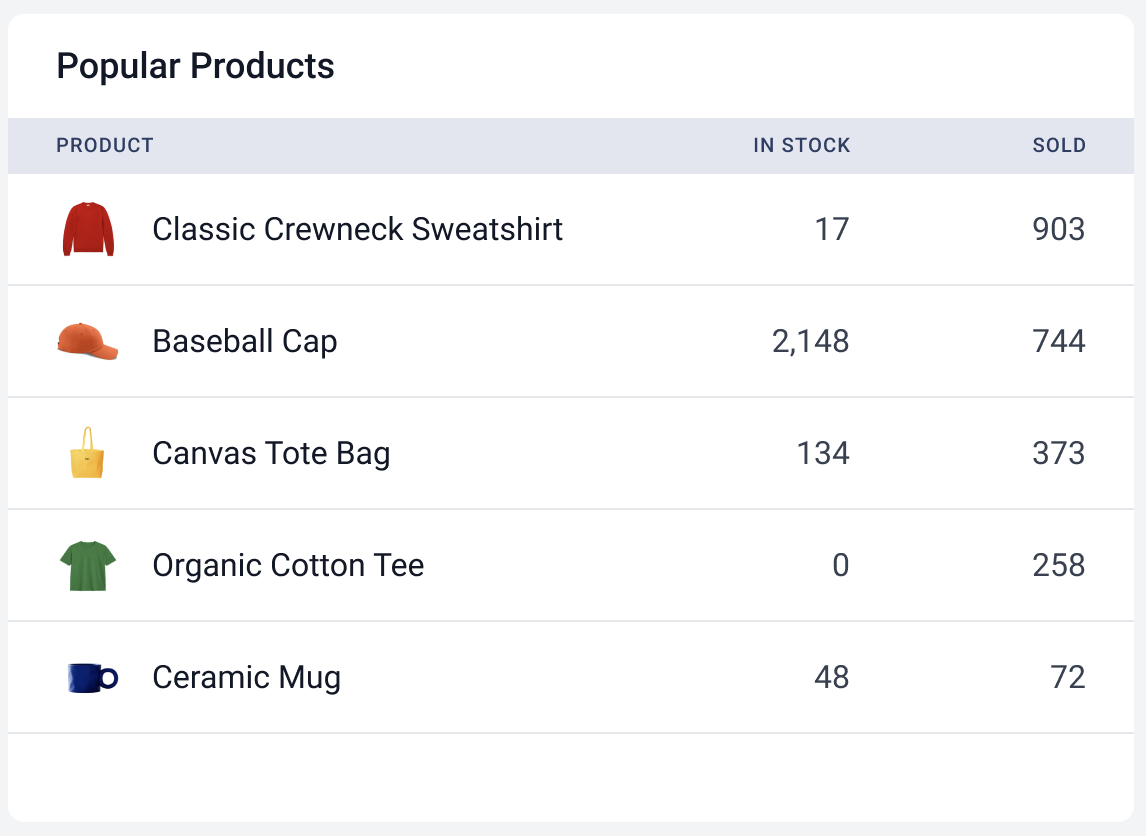
Popular Products Panel
The Popular Products panel lists the top five products for the selected timeframe and Storefronts, along with units sold and current inventory status. If inventory is not tracked for a product, the “In Stock” column will simply display “Yes.”
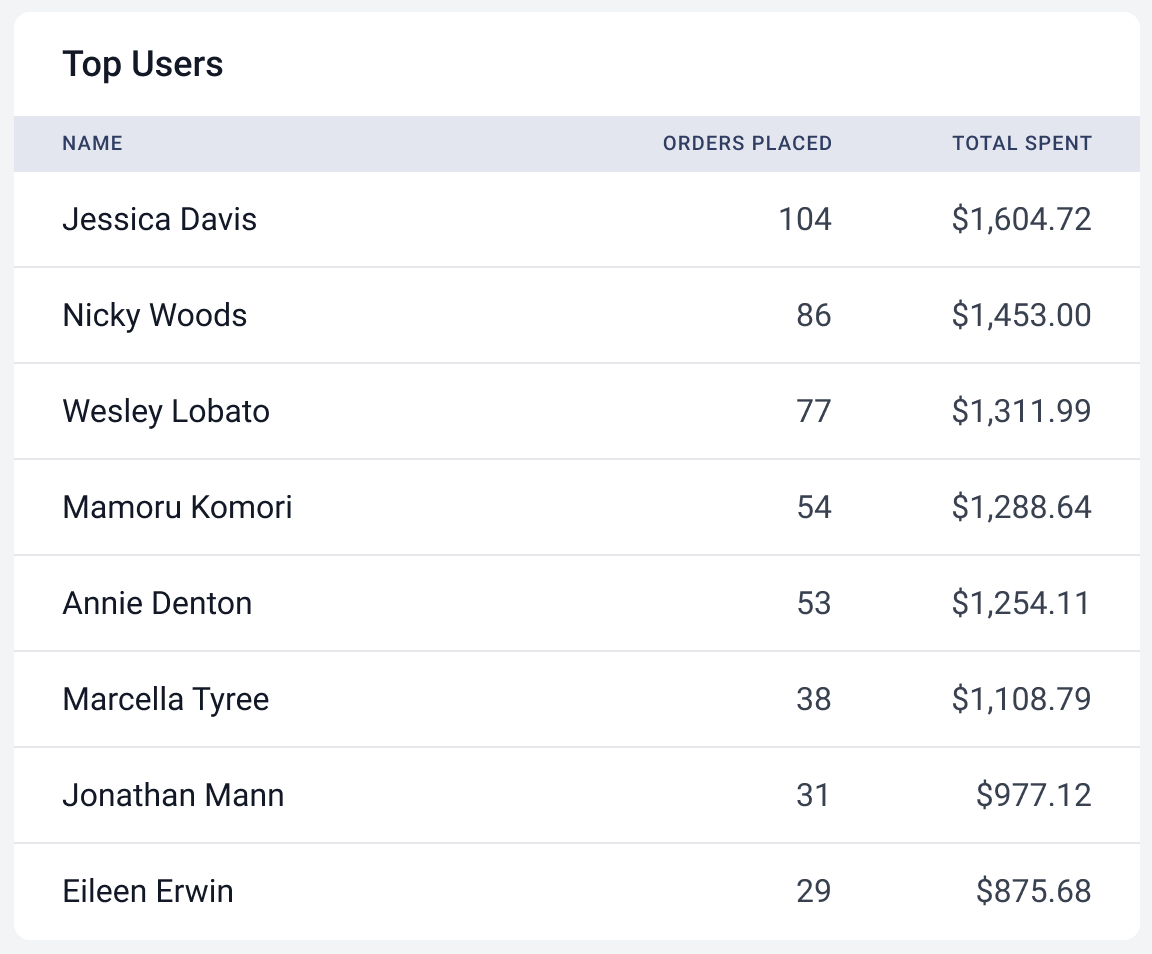
Top Users Panel
The Top Users panel highlights the users with the highest number of orders and their total spend.
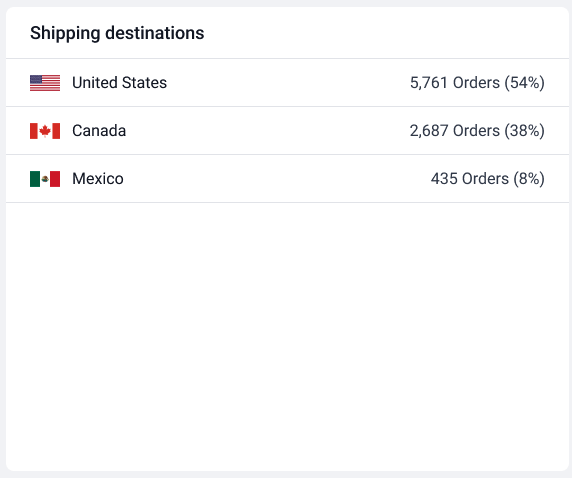
Shipping Destinations Panel
The Shipping Destinations panel breaks down the countries where orders have been shipped, showing both counts and percentages.
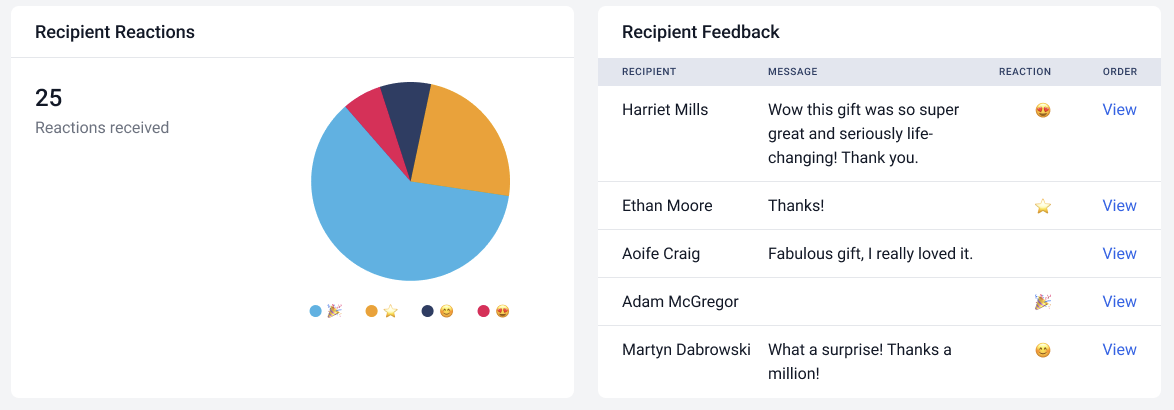
Recipient Reactions and Feedback Panel
The Recipient Reactions panel displays a pie chart of emoji reactions and the Recipient Feedback panel show the most recent messages submitted through Storefront Recipient Feedback. Both panels only appear when Recipient Feedback is enabled for the selected Storefront.
Exporting Your Data
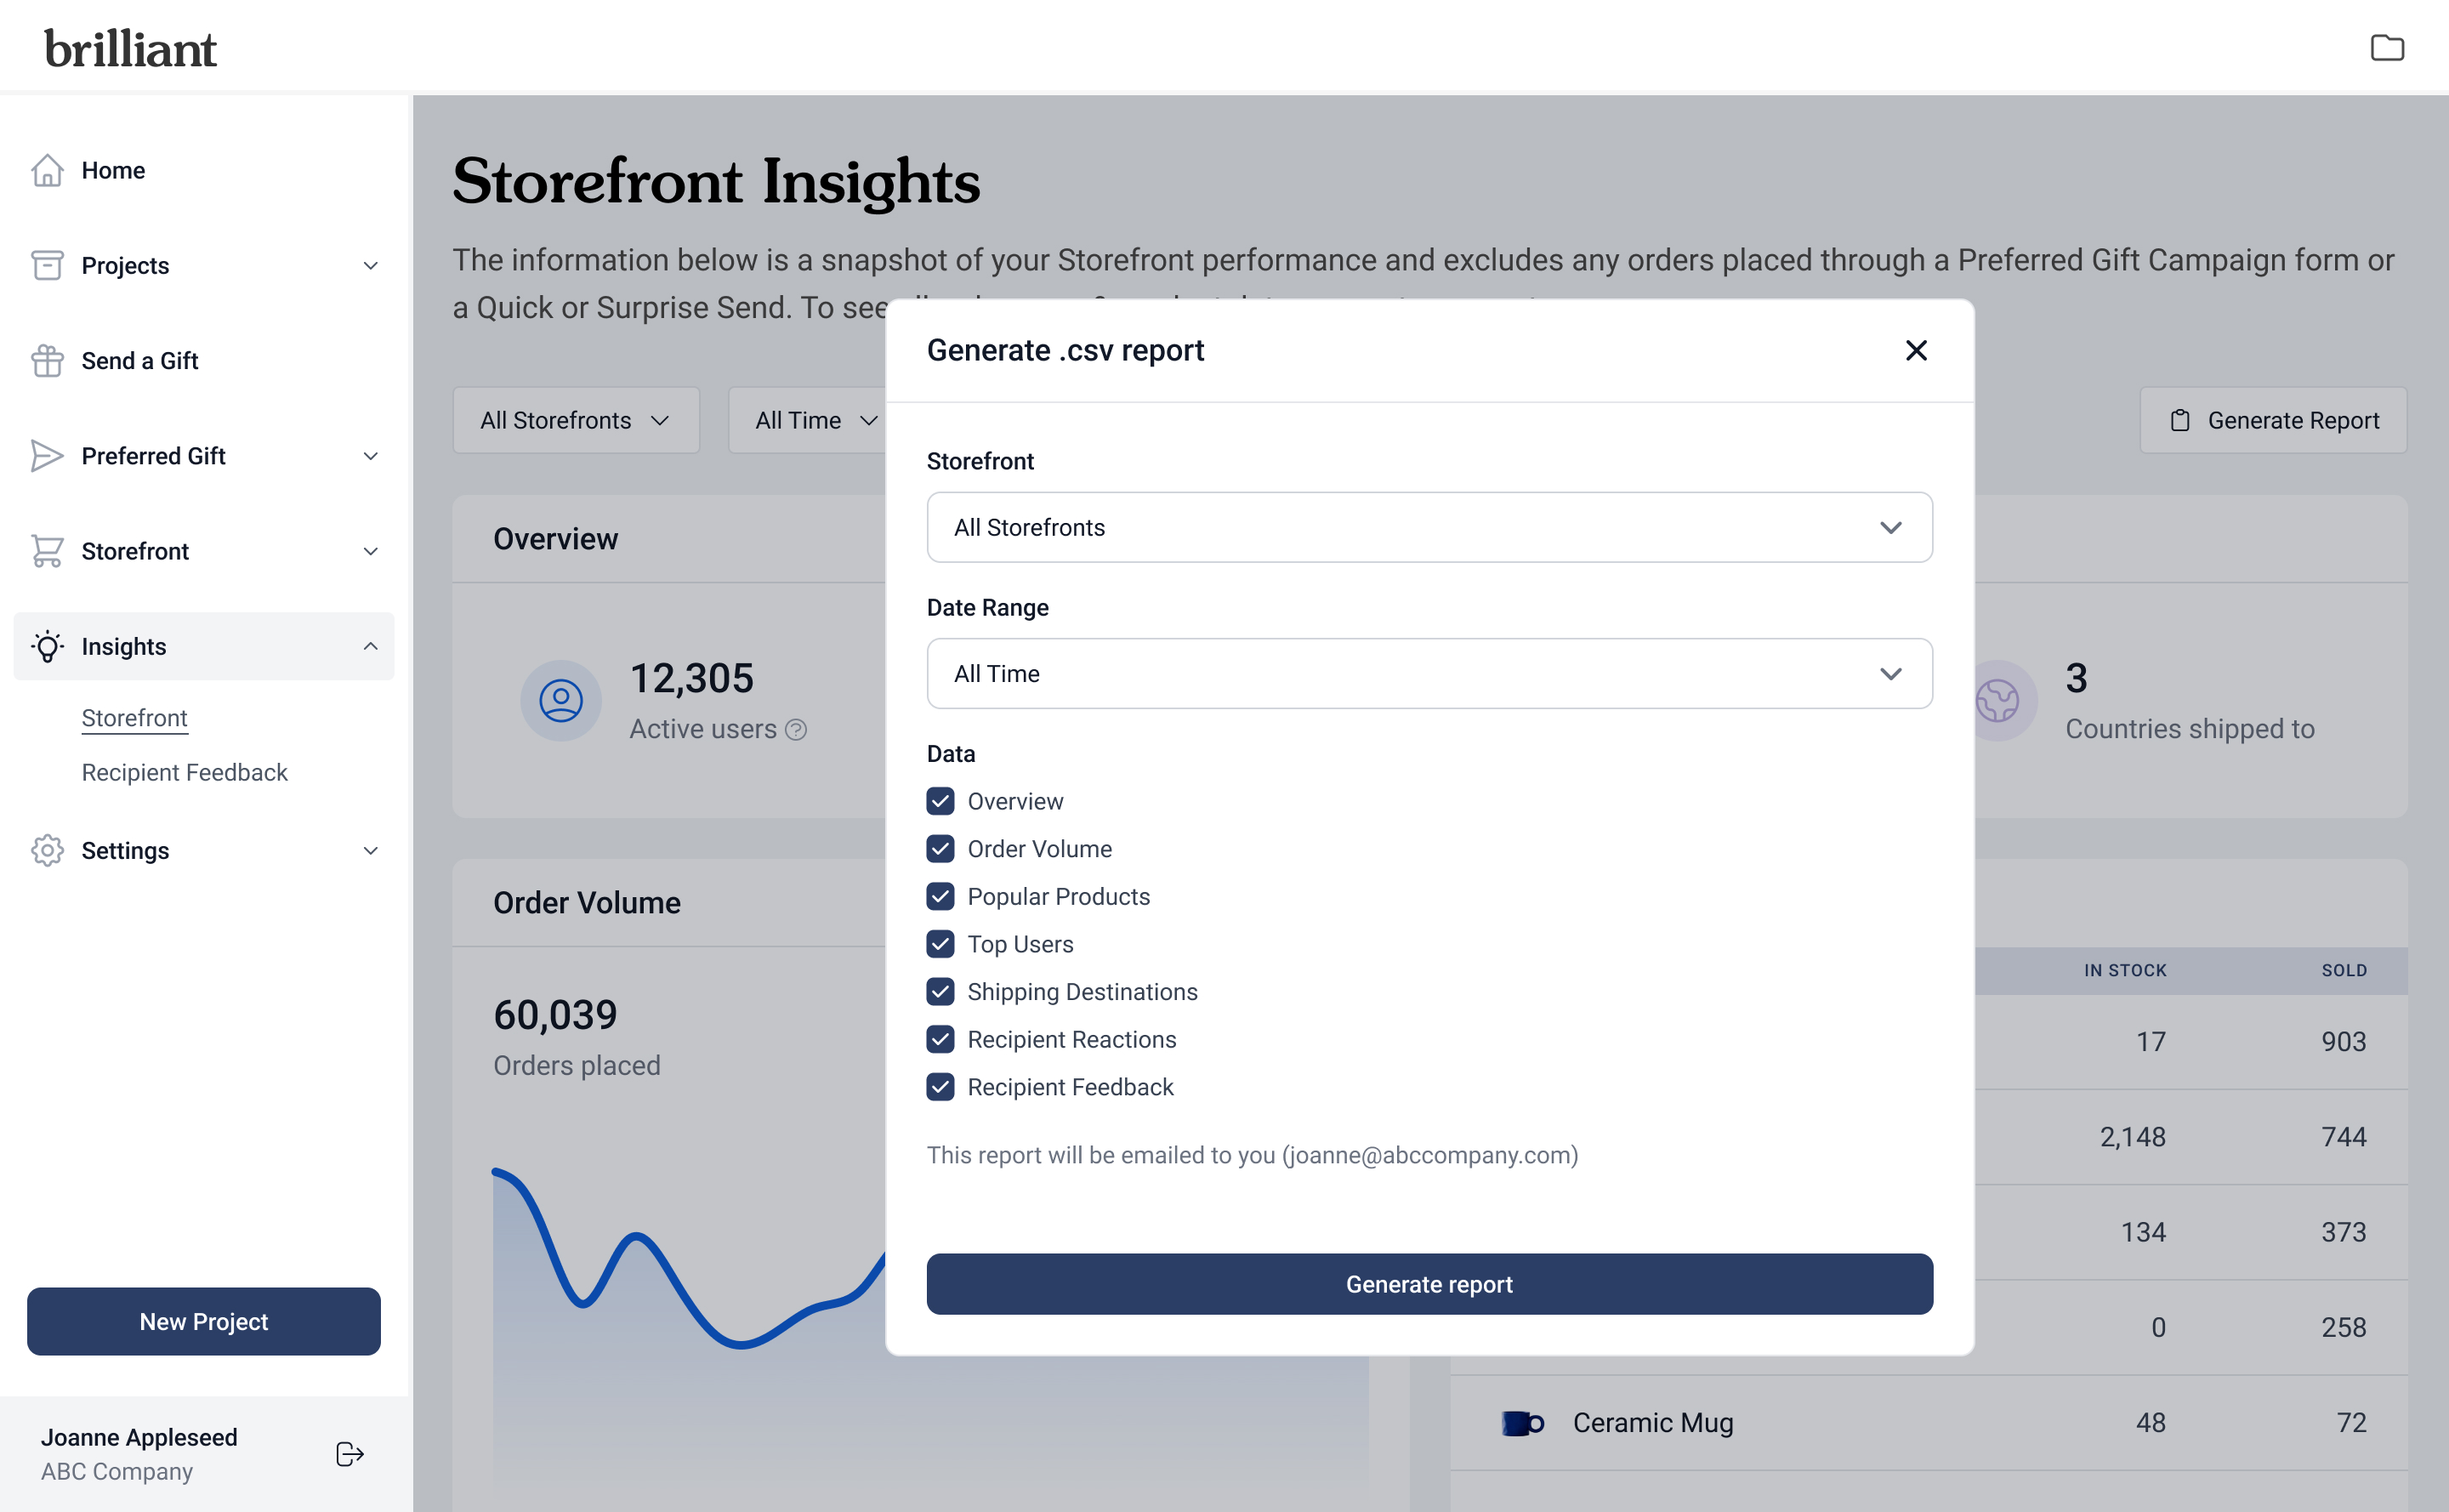
Admins can download CSV reports of the data displayed on the Storefront Insights page. Click the Generate Report button. A modal will open where you can choose Storefronts, Date range, and Panels to include.
Each selected data panel generates a separate CSV file. For example, if all six panels are selected, you will receive a single email containing six different CSVs. Downloaded files can then be shared with your team or integrated into your reporting workflows.
FAQs
Where is the data pulling from?
The Storefront Insights Page only shows data from orders placed on a Storefront. It does not include orders from Preferred Gift Campaigns, Quick Sends, or Surprise Sends.
Can I compare multiple Storefronts at once?
Yes. You can select multiple Storefronts in the dropdown, and the data will combine across them.
Who can access this page?
Only Store Admins have access to the Storefront Insights Page.